Fraud rings rarely depend on one obviously suspicious account. They distribute activity across multiple identities, devices, documents, payment instruments, and transactions so that each account appears normal when reviewed independently.
Graph analysis changes the unit of investigation from an individual account to the network surrounding it. By representing entities as nodes and their relationships as edges, businesses can uncover coordinated behavior that traditional account-level rules may miss.
FinAuth contributes identity, facial, device, document, session, and behavioral signals to this analysis, helping organizations detect when apparently separate accounts are connected through shared or closely related evidence.
1. Why Account-Level Rules Miss Fraud Rings
Traditional fraud rules usually evaluate one application, login, or transaction at a time. They may identify a forged document, high-risk device, unusual transfer, or failed liveness check, but coordinated fraud networks can deliberately avoid strong single-event indicators.
For example, a fraud ring may:
- Use a different document for every account
- Rotate across multiple devices and network environments
- Slightly modify facial images or identity attributes
- Keep each transaction below a fixed threshold
- Move funds through several intermediate accounts
- Reuse only one hidden resource across the network
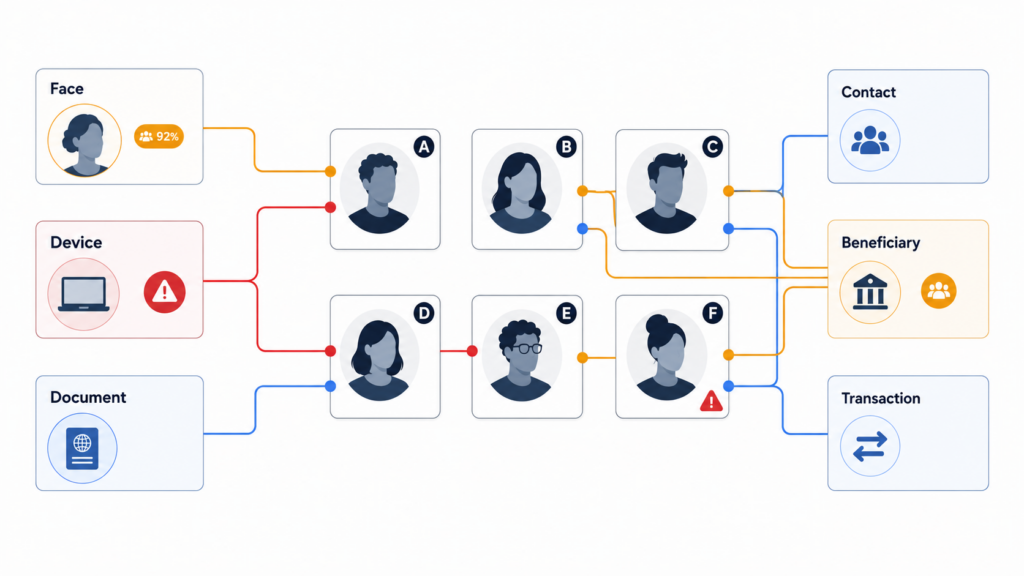
One shared device may not prove fraud. One facial similarity may also be legitimate. However, several new accounts sharing related faces, devices, contact details, and payment paths within a short period create a stronger network-level pattern.
2. How a Fraud Graph Represents Accounts and Relationships
A graph contains two basic components:
Nodes represent entities or events, such as:
- Customer accounts
- Facial identities
- Identity documents
- Devices
- Phone numbers and email addresses
- Addresses
- Payment instruments
- Beneficiaries
- Transactions
- IP addresses or sessions
Edges represent relationships between nodes, such as:
- Account used device
- Face verified account
- Document registered account
- Account paid beneficiary
- Two accounts shared an address
- Device accessed multiple accounts
- Transaction transferred funds between accounts
Edges can include direction, frequency, time, confidence, and risk attributes. A device used by two members of the same household is different from a rooted or injected device used to create dozens of accounts in one hour.
Graph analysis preserves this context instead of treating every shared attribute as equally suspicious.
3. Identity and Device Signals That Reveal Hidden Links
The quality of graph analysis depends on the quality of the entities and relationships entering the graph.
FinAuth can provide several high-value connection signals:
Facial relationships: Face Search 1 can identify accounts associated with the same or highly similar facial identity, even when different names or documents were submitted.
Device relationships: Device and session intelligence can reveal accounts accessed through the same device, high-risk device, virtual environment, injected session, or abnormal technical configuration.
Document relationships: Reused document numbers, portraits, templates, addresses, or manipulated document components may connect multiple applications.
Behavioral relationships: Similar onboarding sequences, repeated failure patterns, synchronized activity, or unusual verification behavior can strengthen a suspected connection.
Risk-history relationships: Previous facial attacks, high-risk-device usage, overdue activity, and association with known risky accounts can provide additional network context.
A single relationship should not automatically create a fraud decision. FinAuth signals can instead be combined with business, account, and transaction data in a graph analysis layer.
4. Graph Patterns Commonly Associated With Fraud Rings
Graph analytics can search for structures that are difficult to identify in tabular account records.
Shared-resource hubs
One device, facial identity, document component, address, or payment instrument connects to an unusually large number of accounts.
Dense account clusters
A group of accounts has many internal relationships but few legitimate connections outside the group. Members may share devices, beneficiaries, contact details, or transaction paths.
Fan-in and fan-out patterns
Many accounts send funds to one beneficiary, or one source rapidly distributes value across multiple accounts. These structures can indicate collection accounts, mule networks, or coordinated promotions abuse.
Circular flows
Funds or value move through several accounts and return to an earlier participant. Cycles can indicate attempts to obscure ownership or manufacture activity.
Multi-hop connections
Two accounts may share no direct attribute but connect through an intermediate face, device, address, beneficiary, or transaction path.
Short-lived bursts
A newly formed cluster creates accounts, completes verification, and begins coordinated activity within a compressed time window.
The BIS Innovation Hub’s Project Aurora found that graph neural networks could use payment relationships to identify suspicious transaction networks more effectively than traditional rule-based approaches in its experimental environment. It also demonstrated the value of broader, privacy-preserving data collaboration for detecting mule-account and smurfing networks. BIS: Artificial Intelligence and the Economy
5. Building a Graph-Based Fraud Detection Workflow
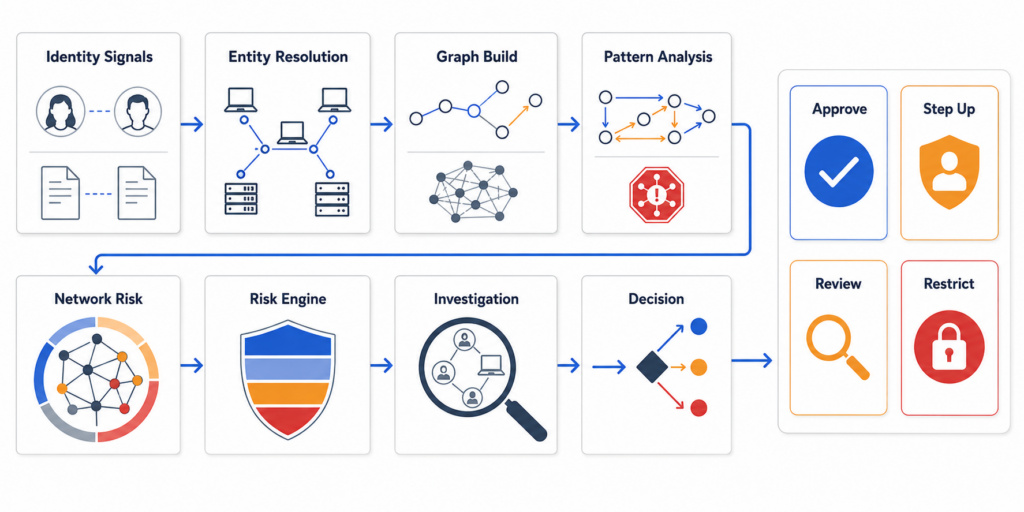
A practical workflow can be organized into five stages.
First, collect reliable signals. Validate documents, extract identity attributes, compare faces, confirm liveness, and evaluate device and session integrity.
Second, resolve entities. Determine whether variations in names, faces, documents, devices, or contact details represent the same entity or merely similar entities. Every link should retain a confidence level.
Third, build and update the graph. Create nodes and edges as onboarding, login, recovery, and transaction events occur. Time should remain part of the graph so analysts can distinguish historical household sharing from a new coordinated attack.
Fourth, analyze network risk. Apply relationship rules, path analysis, community detection, centrality measures, temporal patterns, or graph machine learning. The selected method should match the available data and business objective.
Fifth, apply proportionate action. FinAuth’s Risk Engine can combine identity and device evidence with graph-derived risk indicators to support approval, step-up verification, account restrictions, manual review, or rejection.
6. Make Graph Risk Explainable
A graph-risk score should be supported by evidence that investigators can understand.
Useful explanations include:
- Number of related accounts
- Number of shared or high-risk devices
- Strength of facial relationships
- Shortest path to a confirmed fraudulent account
- Number and type of risky shared attributes
- Cluster size and density
- Transaction value moving through the cluster
- Speed at which the network formed
- Number of previously confirmed attacks in the connected component
Instead of returning only “high risk,” the system can explain that an account is linked to six other accounts through one high-risk device, two related facial identities, and a shared beneficiary.
This improves manual review, rule tuning, case documentation, and investigation prioritization.
7. Control False Positives and Protect Data
Shared attributes do not always indicate collusion. Families may share devices or addresses, businesses may use common networks, and legitimate customers may reuse company contact information.
Graph decisions should therefore consider relationship type, timing, confidence, known context, and the combination of independent signals. Businesses should also monitor performance by cluster type and measure confirmed fraud, false positives, review volume, and investigation outcomes.
FATF notes that data pooling and collaborative analytics can improve pattern detection and reduce false positives, but any exchange or analysis of personal information must comply with applicable privacy and data-protection frameworks. FATF: Data Pooling, Collaborative Analytics and Data Protection
Organizations should apply data minimization, purpose limitation, access control, retention policies, audit logging, and appropriate privacy-enhancing technologies.
8. Fraud Ring Detection Q&A
What is graph analysis in fraud detection?
Graph analysis models accounts, identities, devices, transactions, and other entities as a connected network. It identifies suspicious relationships and group-level patterns that may not appear in individual account checks.
What signals are most useful for detecting linked accounts?
Useful signals include shared or related faces, devices, identity documents, contact details, addresses, payment instruments, beneficiaries, IP environments, and transaction paths.
Does sharing one device prove that accounts belong to a fraud ring?
No. One shared attribute may have a legitimate explanation. Risk becomes stronger when multiple independent connections, abnormal timing, high-risk environments, or known fraudulent nodes overlap.
How does FinAuth support fraud ring detection?
FinAuth provides document, face, liveness, device, session, behavioral, and historical risk signals. These signals can be used to build account relationships and support graph-based risk decisions.
What is the difference between rules and graph machine learning?
Graph rules search for predefined structures, such as one device linked to many accounts. Graph machine learning can learn more complex patterns from connected data, but it requires representative training data, validation, monitoring, and explainability controls.
9. Conclusion
Fraud rings exploit the gaps between individual account reviews. Graph analysis closes those gaps by connecting identities, devices, documents, sessions, and transactions into a unified risk network.
By supplying verified identity and device evidence, FinAuth helps organizations uncover shared infrastructure, multi-hop relationships, suspicious clusters, and coordinated activity. Combined with explainable network indicators and proportionate risk actions, this approach enables businesses to identify hidden fraud structures without treating every shared attribute as proof of collusion.